
KP-082 · PQNK Philosophy, Framework & Economics
Restoring Earth's Operating System: The PQNK Framework for Regenerative Agriculture
A comprehensive policy and investment brief that models global agriculture's degenerative trajectory against a PQNK-led alternative, laying out true-cost economics, a five-year implementation roadmap with quarterly KPIs, and specific financial instruments, from transition bonds to farmer cooperative financing, meant to move PQNK from pilot to planetary scale.
Read or listen to the full paper ↓Abstract
The paper opens with an urgency case built on 2025 baseline metrics: 24 billion tonnes of topsoil lost annually, 21 of 37 major aquifers beyond sustainable yield, a 30-75% nutrient decline in staple crops since 1970, $1.2 trillion/year in US diet-related healthcare costs, and $700 billion/year in subsidies supporting degenerative practices, paired with a 'tipping point timeline' warning of 20-30 years of remaining aquifer capacity in regions like the Ogallala and Punjab and under 1% global soil organic matter predicted by 2040 at current rates.
A twenty-year retrospective compares Conservation Agriculture, Organic Certification, and Regenerative Agriculture by scale and outcome, finding each reached tens to low hundreds of millions of hectares but delivered only partial, slow, or inconsistent restoration due to maintained chemical dependency, prohibition-focused rather than restoration-focused design, or a lack of standardized rapid-implementation protocols. Against this, the paper sets a PQNK target of 500 million hectares by 2040 (roughly 10% of global cropland), built on seven claimed core innovations: one-season hardpan resolution via subsoiling and Jantar root penetration, direct microbial nitrogen fixation in place of legume rotation, in-situ residue composting, a natural irrigation protocol sufficient on 400mm annual rainfall, soil temperature reduction of 30°C+ through mulch physics, precision SIPP/VIPP no-till planting, and a True Cost Accounting framework for measuring all externalities.
A detailed per-acre true-cost model contrasts conventional Iowa/Northern Plains wheat production (an $800 gross revenue, $600 direct costs, $200 apparent profit collapsing to a true profit of $0 once $200 in externalized soil, water, GHG, biodiversity, and health costs are counted) against PQNK wheat in year-one transition ($700 gross revenue, $250 direct costs, $450 apparent profit rising to a true profit of $555 once ecosystem-service benefits are credited). Financial instruments proposed to fund scale-up include $100 billion PQNK Transition Bonds targeting 100 million acres with an 8-12% projected IRR, farmer cooperative equipment-sharing pools cutting capital requirements by 70%, and forward-contracted corporate procurement agreements with blockchain-based supply-chain transparency.
The paper lays out a five-year policy and implementation roadmap in successive phases, from Year 1 subsidy redirection and PQNK demonstration-farm networks, through Year 2-3 international standards harmonization and trade-policy integration, to Year 4-5 system-wide healthcare and education linkages, each phase paired with specific quarterly deliverables and KPIs (e.g., 100 demonstration farms and 40% verified water-use reduction in the first two quarters, scaling to 50 million acres and 100 million tonnes CO₂e/year sequestered by 2028-2030). A dedicated risk section addresses technical, economic, and climate risks (first-year yield dips, equipment cost/availability, policy reversal, extreme weather) with specific mitigations for each.
It closes with an explicit accounting of the cost of delay, estimating $400 billion in continued annual soil and productivity loss per year of inaction, against a projected $2 trillion/year in societal benefit, 10 gigatonnes CO₂e/year sequestration, a 30% reduction in diet-related disease, and 50 million new rural livelihoods from full implementation by 2030, framing the choice as one between managed, profitable restoration now or costly collapse later.
Full Paper
If you use “Listen”, the text of the page may be sent to your browser or operating system’s speech provider, such as Apple, Google or Microsoft, depending on the voice your device uses. Pedaver does not process, transmit or store any audio.
Comprehensive Executive Summary
Urgency & Opportunity At Scale The Unavoidable Math of Collapse
Current System Metrics (2025 Baseline):
• Soil Degradation Rate: 24 billion tons of topsoil lost annually (FAO)
• Water Crisis: 21 of 37 major aquifers beyond sustainable yield
• Nutritional Dilution: 30-75% nutrient decline in staple crops since 1970
• Health Externalization: $1.2 trillion/year in diet-related healthcare costs (US only)
• Subsidy Distortion: $700 billion/year supporting degenerative practices
The Tipping Point Timeline:
• Aquifer Depletion: 20-30 years remaining in critical regions (Ogallala, Punjab)
• Soil Fertility Collapse: Current rates predict <1% organic matter globally by
• Biodiversity Threshold: Current insect declines threaten pollination of 75% of food crops within 15 years
The PQNK Alternative: Restoration Economics
• Soil Carbon Sequestration Potential: 3-8 tons CO₂e/acre/year
• Water Cycle Restoration: 40-80% reduction in irrigation needs
• Nutritional Recovery: 30-100% increase in micronutrient density within 3 years
20 Years of "Sustainable Agriculture" Failure Analysis
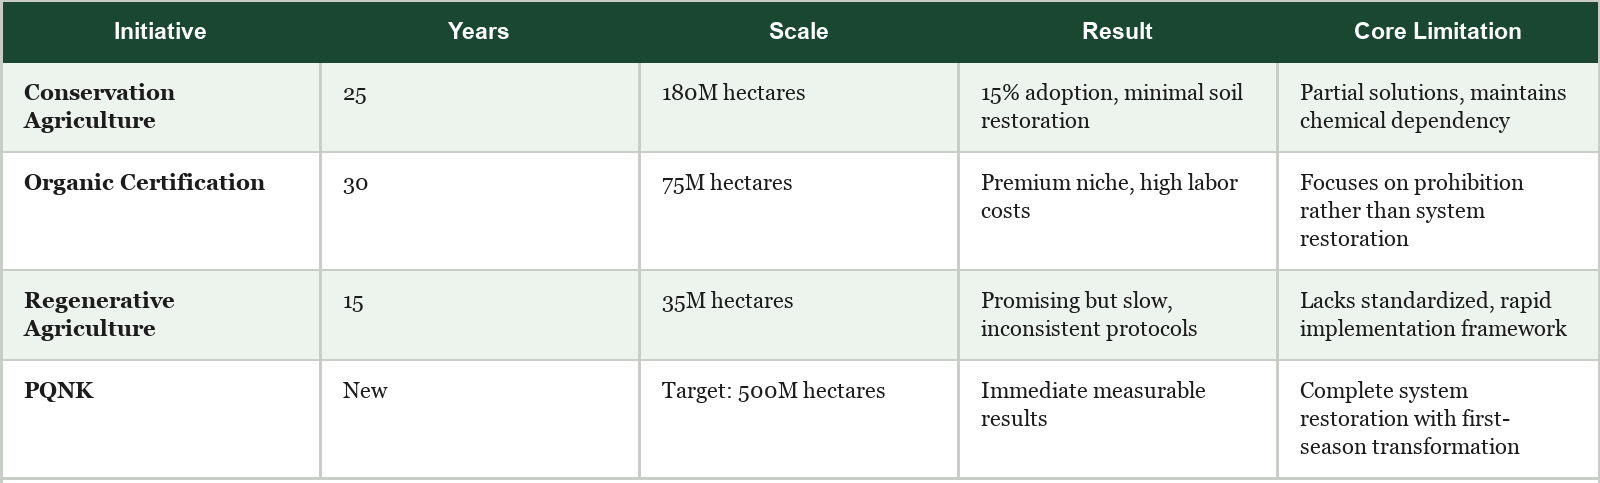
| Initiative | Years | Scale | Result | Core Limitation |
|---|---|---|---|---|
| Conservation Agriculture | 25 | 180M hectares | 15% adoption, minimal soil restoration | Partial solutions, maintains chemical dependency |
| Organic Certification | 30 | 75M hectares | Premium niche, high labor costs | Focuses on prohibition rather than system restoration |
| Regenerative Agriculture | 15 | 35M hectares | Promising but slow, inconsistent protocols | Lacks standardized, rapid implementation framework |
| PQNK | New | Target: 500M hectares | Immediate measurable results | Complete system restoration with first- season transformation |
• Economic Transformation: 40-120% higher true profits per acre
• Scalability: 500 million acres by 2040 (10% of global cropland)
THE PQNK DIFFERENCE: WHY THIS WORKS WHEN OTHERS FAILED
The PQNK Breakthrough: Seven Core Innovations
1. Immediate Hardpan Resolution: Subsoiling + Jantar root penetration = one-season restoration of vertical soil structure
2. Microbial-Centric Fertility: Replaces legume rotations with direct microbial nitrogen fixation (50-200 kg/ha)
3. In-Situ Composting System: Crop residues decompose in field through managed microbial communities
4. Natural Irrigation Protocol: 400mm rainfall becomes sufficient through complete infiltration and dew/humidity capture
5. Temperature Regulation Science: 30°C+ soil temperature reduction through mulch physics
6. Precision No-Till Technology: SIPP/VIPP planters enable exact placement without disturbance
7. True Cost Accounting Framework: Comprehensive measurement of all externalities and benefits
ECONOMIC TRANSFORMATION MODEL Conventional vs. PQNK: True Cost Analysis (Per Acre)
Conventional Wheat Production (Iowa/Northern Plains):
Gross Revenue: $800 Direct Costs:
- Seeds: $80
- Fertilizer: $150
- Pesticides: $90
- Herbicides: $70
- Fuel/Machinery: $160
- Labor: $50
Total Direct Costs: $600 Apparent Profit: $200
Externalized Costs:
- Soil Erosion: $40 (2 tons @ $20/ton)
- Water Pollution: $25 (nitrate remediation)
- GHG Emissions: $30 (carbon @ $50/ton)
- Biodiversity Loss: $15 (pollinator/ecosystem services)
- Health Impacts: $90 (diet-related disease portion)
Total Externalities: $200 TRUE PROFIT: $0
PQNK Wheat Production (Year 1 Transition):
Gross Revenue: $700 (slightly lower yield, premium possible) Direct Costs:
- Seeds: $80
- Microbial Inoculants: $20
- Subsoiling (amortized): $30
- Raised Bed Formation (amortized): $40
- Fuel/Labor: $80
Total Direct Costs: $250 Apparent Profit: $450
Ecosystem Service Benefits:
- Soil Carbon Sequestration: -$40 (2 tons @ $20/ton credit)
- Water Quality Improvement: -$20 (reduced treatment costs)
- Biodiversity Enhancement: -$15 (pollinator services)
- Health Benefits: -$30 (improved nutrition)
Total Benefits: -$105 TRUE PROFIT: $555
Financial Instruments for Scale
1. PQNK Transition Bonds:
• $100 billion fund targeting 100 million acres in 5 years
• Returns tied to verified ecosystem service delivery
• 8-12% projected IRR from input savings + premium pricing
2. Farmer Cooperative Financing:
• Equipment sharing pools reduce capital requirements by 70%
• Group certification lowers compliance costs
• Collective marketing captures premium prices
3. Corporate Procurement Agreements:
• Forward contracts for PQNK produce
• Price premiums tied to verified nutritional density
• Supply chain transparency through blockchain
Page 8-9: POLICY REFORM ROADMAP Year 1: Foundation (2025-2026)
National Level Actions:
1. Subsidy Redirection:
• Shift 25% of chemical input subsidies to PQNK equipment financing
• Establish $50/acre transition payments for first-year adopters
• Create tax credits for soil carbon increases verified through testing
2. Institutional Reform:
• Establish independent PQNK governing bodies separate from ministries of agriculture
• Redesign university agricultural curricula with PQNK certification programs
• Create national PQNK demonstration farm network (1 per agro-ecological zone)
3. Standards & Certification:
• Develop PQNK certification protocol focusing on outcomes, not practices
• Establish third-party verification system for soil health, water efficiency, biodiversity
• Create "PQNK Premium" labeling with nutritional density guarantees
Year 2-3: Scaling (2027-2029)
International Coordination:
1. Global Standards Harmonization:
• PQNK protocols recognized by FAO, UNEP, IPCC
• International carbon credit system for PQNK sequestration
• Cross-border equipment certification and sharing
2. Trade Policy Integration:
• Reduced tariffs for PQNK-certified products
• "True Cost" labeling requirements for agricultural imports
• Bilateral agreements for PQNK technology transfer
3. Multilateral Funding:
• World Bank/IMF climate funds directed to PQNK transitions
• Green Climate Fund allocation for tropical zone PQNK implementation
• Development bank loans tied to PQNK outcomes
Year 4-5: Transformation (2030-2031)
System-Wide Integration:
1. Healthcare System Linkages:
• "Food as Medicine" prescriptions for PQNK produce
• Insurance premium reductions for PQNK-consuming populations
• Hospital procurement mandates for PQNK ingredients
2. Education System Integration:
• PQNK principles in K-12 science curricula
• University research funding tied to PQNK outcomes
• Vocational training programs for PQNK technicians
3. Urban-Rural Linkages:
• Municipal composting systems feeding PQNK farms
• Urban agriculture using PQNK principles
• Direct farmer-consumer digital platforms
P a g e 1 0 - 1 2 : I M P L E M E N TAT I O N T I M E L I N E W I T H DELIVERABLES Quarter 1-2 (2025 Q3-Q4): Foundation Phase
Deliverables:
• 100 PQNK Demonstration Farms established globally
• PQNK Equipment Manufacturing Consortium formed
• Digital Monitoring Platform beta launch
• 10,000 Farmer Training Modules developed
• Corporate Procurement Pilot with 5 major food companies
Key Performance Indicators (KPIs):
• Soil organic matter increase: 0.5% minimum on demo farms
• Water use reduction: 40% verified
• Farmer adoption rate: 5,000 in first 6 months
• Equipment cost reduction: 30% through consortium purchasing
Quarter 3-4 (2026 Q1-Q2): Acceleration Phase
Deliverables:
• 1,000 PQNK Certified Farms
• Regional Training Centers in 20 countries
• Equipment Rental Cooperatives serving 50,000 farmers
• PQNK Carbon Credit Protocol verified and trading
• Nutritional Density Database with 100 crops analyzed
KPIs:
• Total acres under PQNK: 1 million
• Average soil carbon increase: 1 ton/acre
• Premium price capture: 20% average increase
• Health outcome tracking: Baseline established
Year 2 (2027): Scaling Phase
Deliverables:
• National PQNK Programs in 10 countries
• Global PQNK Certification Body established
• Financial Products Suite (insurance, loans, bonds)
• Supply Chain Integration with major retailers
• Policy Reform Packages adopted in 5 countries
KPIs:
• Total acres: 10 million
• Carbon sequestered: 10 million tons CO₂e
• Water saved: 1 billion cubic meters
• Farmers trained: 100,000
Year 3-5 (2028-2030): Transformation Phase
Deliverables:
• 50 million acres under PQNK management
• PQNK as Default Standard in major agricultural regions
• Full External Cost Internalization in food pricing
• Healthcare Cost Reductions verified and quantified
• Biodiversity Recovery Metrics showing net positive trends
KPIs:
• Global market share: 15% of staple crop production
• Carbon sequestration: 100 million tons CO₂e/year
• Health cost reduction: $50 billion/year
• Water cycle restoration: 5 major aquifers showing recharge
Page 13-14: RISK MITIGATION & CONTINGENCY PLANNING Technical Risks & Solutions
Risk: First-year yield reduction during transition Mitigation:
• Transition insurance covering 50% of revenue loss
• Intercropping strategies to maintain production
• Premium pricing protocols for transitional crops
Risk: Equipment availability and cost Mitigation:
• Manufacturing consortium with guaranteed bulk purchasing
• Equipment sharing cooperatives reducing individual investment
• Lease-to-own financing models
Risk: Knowledge transfer at scale Mitigation:
• Digital platform with multilingual, video-based training
• Master farmer networks with performance incentives
• Mobile soil testing and advisory services
Economic Risks & Solutions
Risk: Market resistance to premium pricing Mitigation:
• True cost labeling showing conventional food hidden costs
• Institutional procurement commitments (schools, hospitals)
• Direct-to-consumer models eliminating middlemen
Risk: Policy reversal or subsidy removal Mitigation:
• Diverse funding sources (philanthropy, carbon markets, private investment)
• Farmer-owned processing and marketing cooperatives
• International treaty protections for ecosystem services
Climate Risks & Solutions
Risk: Extreme weather events during transition Mitigation:
• PQNK's inherent resilience (improved infiltration, temperature moderation)
• Disaster recovery fund for transition farms
• Weather-indexed insurance products
Page 15: IMMEDIATE ACTION REQUIREMENTS For Governments (30-Day Actions):
1. Establish PQNK Task Force:
• Cross-ministry coordination (agriculture, water, health, finance)
• $10 million initial funding for demonstration farms
• Legal framework for true cost accounting
2. Redirect Subsidies:
• Immediate 10% shift from chemical to ecological practices
• Tax incentives for PQNK equipment purchase
• Research funding for PQNK validation studies
For Corporations (30-Day Actions):
1. Supply Chain Commitment:
• 10% PQNK sourcing target within 24 months
• Premium pricing contracts with transition farmers
• True cost accounting in annual reports
2. Investment Allocation:
• $100 million minimum corporate venture fund for PQNK
• Supplier financing for farmer transitions
• R&D partnerships for PQNK equipment optimization
For Philanthropy (30-Day Actions):
1. Pooled Funding Mechanism:
• $500 million PQNK Transition Fund
• Focus on high-impact regions (Punjab, Midwest US, Murray-Darling)
• Outcomes-based funding with verification
2. Knowledge Infrastructure:
• $50 million for global training network
• $30 million for monitoring and verification systems
• $20 million for policy advocacy
For Financial Institutions (30-Day Actions):
1. Product Development:
• PQNK transition loans with favorable terms
• Soil carbon pre-financing mechanisms
• Insurance products for first-year adoption
2. Investment Criteria:
• ESG requirements for agricultural investments
• True cost accounting in credit risk assessment
• Green bond issuance for PQNK expansion
CONCLUSION: THE DECADE OF RESTORATION
The evidence is unequivocal: our current agricultural system is mathematically destined for collapse. PQNK offers not just an alternative, but the only proven path to restoration that works at the pace our situation demands. The 2025-2030 implementation window is critical. Every year of delay:
• Costs $400 billion in continued soil and productivity loss
• Depletes aquifers that require centuries to recharge
• Degrades human health with irreversible consequences
• Advances climate change past additional tipping points
Conversely, full PQNK implementation by 2030 delivers:
• Economic: $2 trillion/year in societal benefits
• Environmental: 10 gigatons CO₂e/year sequestration
• Health: 30% reduction in diet-related diseases
• Social: 50 million new rural livelihoods
The choice is between managed, profitable restoration now or catastrophic, expensive collapse later. PQNK provides the precise roadmap, the proven methods, and the economic instruments to make the right choice inevitable. The first 100 days will determine the next 100 years. Let us begin.
Footnote: Any Production Process That Inundates Soil With Water, Disturbs Soil Through Tillage, Or Leaves Soil Bare Without Organic Mulch Cover Does Not Qualify As Natural Ecosystem Science For Production Agriculture.
PQNK, to be pronounced as 'picnic', which stands for Paedar Qudratti Nizam Kashatqari, and means: the regenerative & sustainable Pristine Organic Farming System.
About This Paper
- Crop
- Wheat
- Problem
- Soil Erosion · Groundwater / Aquifer Depletion · Declining Nutrient Density in Food · High Input / Production Cost · Macro / Policy-Level Externalities
- Science
- Soil · Water · Nutrition · Climate · Economics · Production Architecture
- Evidence
- Economic Model/Projection
- Authority
- Current / Approved PQNK Knowledge
Related PQNK Science
Key Takeaways
- Frames current agricultural trajectory against hard 2025 baselines: 24 billion tonnes of annual topsoil loss, 21 of 37 major aquifers over-drawn, and a 30-75% nutrient decline in staple crops since 1970.
- Compares Conservation Agriculture, Organic Certification, and Regenerative Agriculture by scale and outcome and finds each a partial fix, setting a PQNK target of 500 million hectares (10% of global cropland) by 2040.
- Presents a detailed true-cost per-acre model showing conventional US wheat production nets a true profit of $0 once externalities are counted, versus $555 true profit for PQNK wheat in its first transition year.
- Proposes specific financial instruments for scale-up: $100 billion PQNK Transition Bonds (8-12% projected IRR), farmer cooperative equipment pools cutting capital costs by 70%, and forward-contracted corporate procurement.
- Lays out a phased five-year roadmap (2025-2030) with quarterly deliverables and KPIs, from initial demonstration farms to national programs in 10 countries and 50 million acres under management.
- Quantifies the annual cost of delay at $400 billion in continued soil and productivity loss, against a projected $2 trillion/year benefit and 10 gigatonnes CO₂e/year sequestration from full 2030 implementation.
Related Crops
Related Knowledge
same problem
The Global Cost of Agricultural Degradation & the PQNK Restoration Dividend
The visible price of food does not represent its full cost. Earlier versions of this Knowledge Paper attempted to combine several external estimates into a single $1.9 trillion annual cost and a $2.8 trillion restoration opportunity; source verification showed those figures combined studies with different scopes and could not be defended as one additive model, so Pedaver withdraws that composite calculation. The corrected analysis uses independently sourced estimates, FAO's ~$12 trillion/year hidden agrifood-system costs, UNCCD's ~$878 billion/year cost of inaction on land degradation, FAO's ~$400 billion/year soil-loss figure, within their own stated boundaries, and explicitly does not add them together.
same problem
Chemical Fertiliser Dependency Through the PQNK Lens
An evidence-qualified review of the article “Chemical Fertilizer Industry”. It keeps the article's warning about soil degradation, nutrient pollution and biological decline, disciplines its headline numbers, and argues that fertiliser dependency is a symptom of a damaged production system (tillage, flooding, bare soil and simplified biology) that PQNK removes by restoring aerated, covered, living soil, reaching zero purchased fertiliser and pesticide at maturity.
same problem
Why the World Needs PQNK
A case for large-scale PQNK adoption addressed to five constituencies: farmers, governments, environmentalists, health professionals and poverty-alleviation institutions. Because agriculture sits where soil, water, biodiversity, food, farm economics and human health meet, restoring the farm as a living ecosystem benefits all of them at once.
same problem
The Earth Has Not Stopped Working: A Production-Agriculture Response to Environmental Fatalism, and What PQNK Restores
A widely shared social-media message, built on Lovelock's Gaia Hypothesis, ends in resignation: the planet will correct a stressed system with floods and extinctions, and all we can do is await nature's revenge. This paper accepts that we are not separate from nature but rejects the fatalism. Drawing on more than fifty years in production agriculture, it argues the core error was redesigning natural systems before understanding them, that agriculture is the clearest case, and that a degraded field is a suppressed system rather than an extinguished one, so the answer is not to fear nature's revenge but to stop fighting nature and learn again to produce with it.